Example Dataset#
Setup and Helper Functions#
[1]:
import matplotlib.pyplot as plt
import seaborn as sns
from fau_colors import cmaps

from pepbench.example_data import get_example_dataset

%matplotlib inline
%load_ext autoreload
%autoreload 2
[2]:
plt.close("all")

palette = sns.color_palette(cmaps.faculties)
sns.set_theme(context="notebook", style="ticks", font="sans-serif", palette=palette)

plt.rcParams["figure.figsize"] = (10, 5)
plt.rcParams["pdf.fonttype"] = 42
plt.rcParams["mathtext.default"] = "regular"

palette
[2]:
[3]:
dataset = get_example_dataset()
dataset
Downloading file 'example_dataset.zip' from 'https://raw.githubusercontent.com/empkins/pepbench/v0.2.0/example_data/example_dataset.zip' to '/home/docs/checkouts/readthedocs.org/user_builds/pepbench/checkouts/latest/docs/_build/.cache/xdg/pepbench/v0.2.0'.
100%|█████████████████████████████████████| 1.59M/1.59M [00:00<00:00, 2.27GB/s]
[3]:
ExampleDataset [2 groups/rows]
participant
0
VP_001
1
VP_002
| participant | |
|---|---|
| 0 | VP_001 |
| 1 | VP_002 |
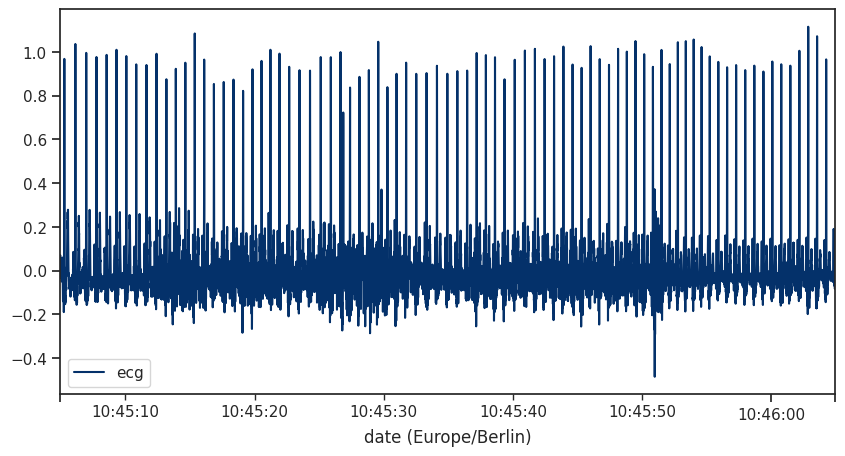
[4]:
subset = dataset.get_subset(participant="VP_001")

subset.ecg.plot()
[4]:
<Axes: xlabel='date (Europe/Berlin)'>
[5]:
subset.reference_heartbeats
[5]:
| start_sample | end_sample | |
|---|---|---|
| heartbeat_id | ||
| 0 | 16 | 443 |
| 1 | 443 | 866 |
| 2 | 866 | 1270 |
| 3 | 1270 | 1664 |
| 4 | 1664 | 2050 |
| ... | ... | ... |
| 77 | 28145 | 28496 |
| 78 | 28496 | 28841 |
| 79 | 28841 | 29184 |
| 80 | 29184 | 29533 |
| 81 | 29533 | 29885 |
82 rows × 2 columns
[ ]:
[ ]: